Tag
#model-evaluation
7 articles
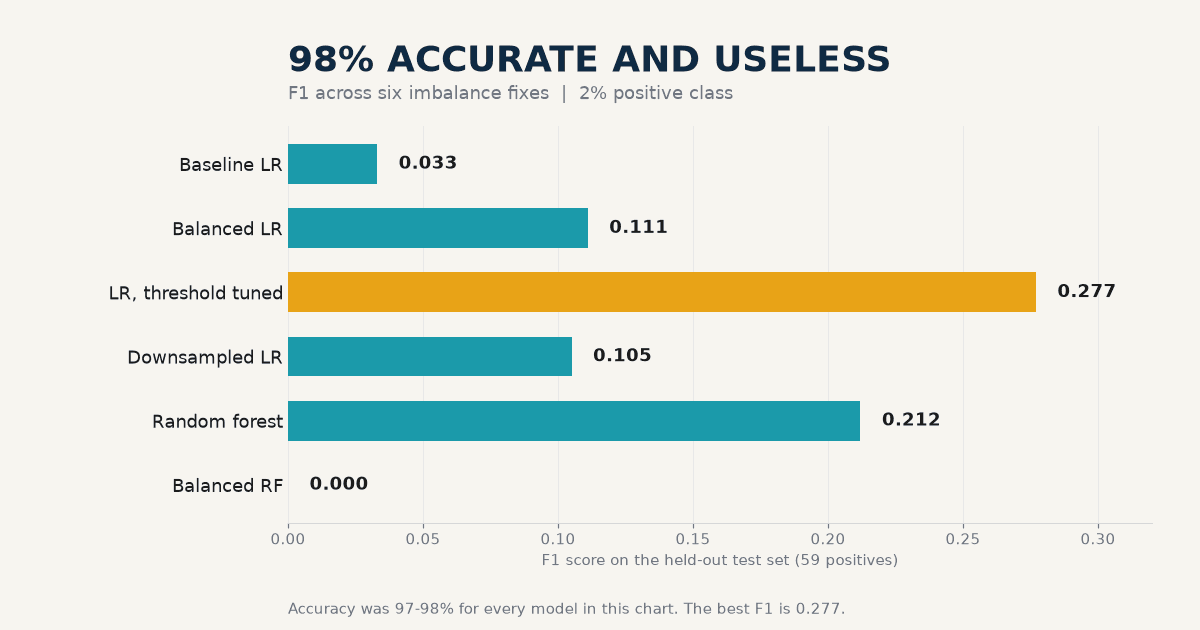
98% Accurate and Useless: Six Imbalance Fixes, Measured on a 2% Positive Class
Six models on one 2% positive dataset: the baseline caught 1 of 59 positives, class weights caught 45 at 6% precision, and a balanced random forest predicted zero positives despite the best AUC. Threshold tuning was the only fix that raised F1.
Ibrahim Denis Fofanah·Nov 12, 2026·11 min
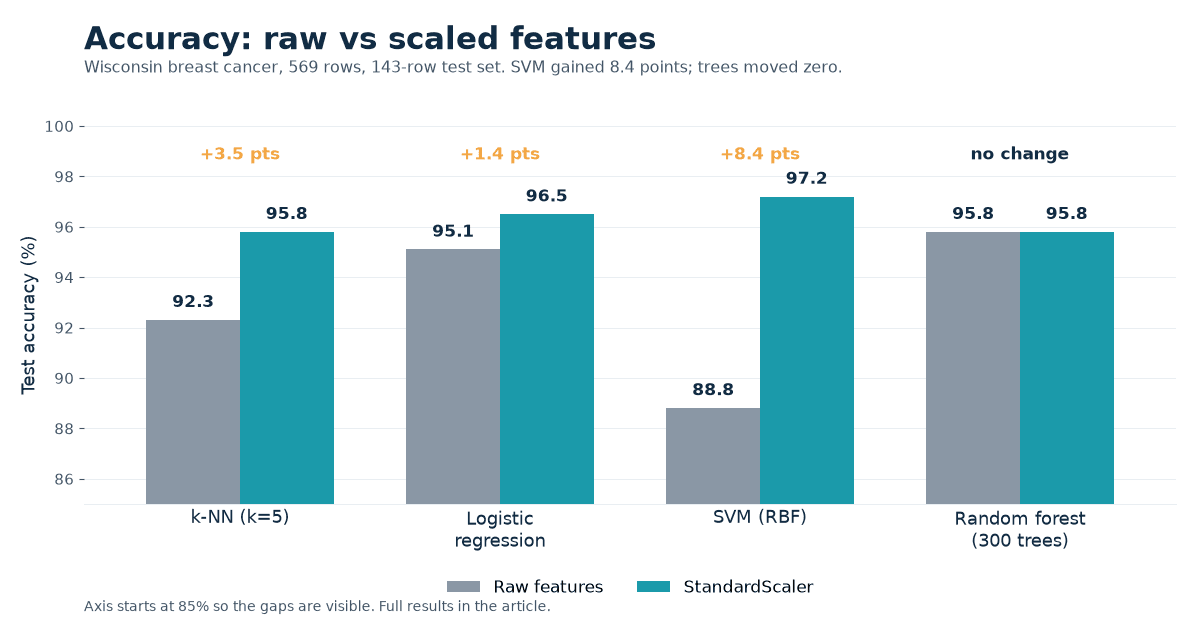
Scaling Gave SVM 8 Points and Trees Nothing. I Ran Four Models Raw and Scaled.
SVM went from 88.8% to 97.2% accuracy with one preprocessing line. Random forest moved zero. Logistic regression stopped warning and converged in 20 iterations instead of 1,000.
Ibrahim Denis Fofanah·Nov 7, 2026·10 min
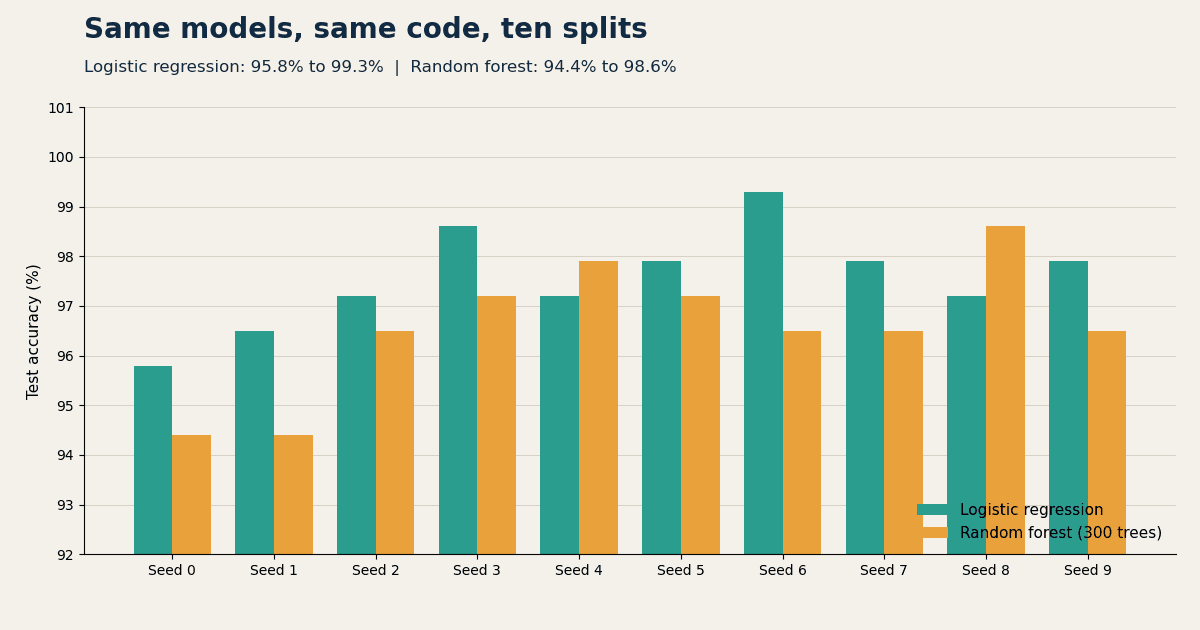
Same Model, Ten Seeds, a 3.5-Point Swing: Why One Split Is Not a Result
Same data, same code, ten split seeds. Logistic regression ranged from 95.8% to 99.3%, and the "winning" model flipped on two seeds. A single split is not a result.
Ibrahim Denis Fofanah·Nov 2, 2026·8 min
Frontier Models Can Spot a Broken Experiment. They Still Pick It One Time in Five
Tampered ML gave 22 frontier models 1,858 pairs of near-identical experiment proposals, one sound and one with a single planted flaw. The best model was right in both orders 77.9% of the time. Order swaps, added detail, and conventional practice flipped the rest.
Ibrahim Denis Fofanah·Oct 30, 2026·11 min
79% Accurate, Give or Take 8 Points: What a Bootstrap Interval Says About Your Test Score
One logistic model scored on test sets of 100, 400, and 1,600 rows. The 95% bootstrap interval shrank from 17 points wide to 4 as the test set grew, and 20 fresh test sets of 400 rows landed anywhere from 73.8% to 82.3%. Report the interval with the score.
Ibrahim Denis Fofanah·Oct 29, 2026·8 min
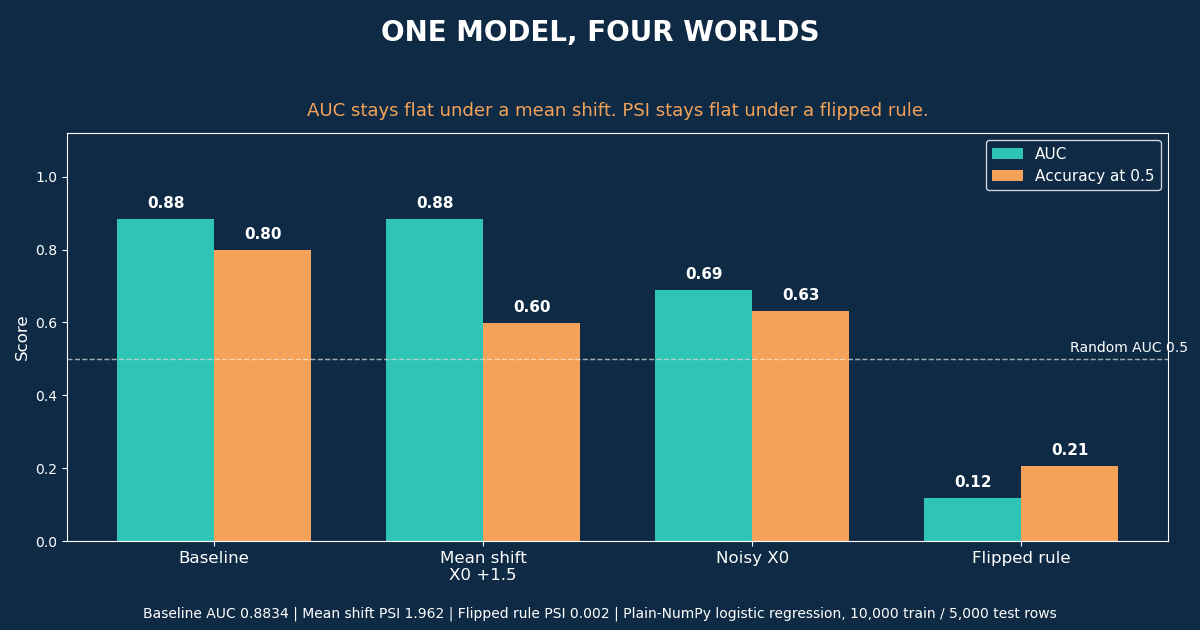
Drift Is Three Different Failures, and One Metric Cannot See Them All
One logistic model, four test scenarios: a mean shift that broke accuracy but not AUC, added noise that hurt both, and a flipped rule that PSI could not see at all. The table, the code, and the monitoring checklist.
Ibrahim Denis Fofanah·Oct 24, 2026·9 min
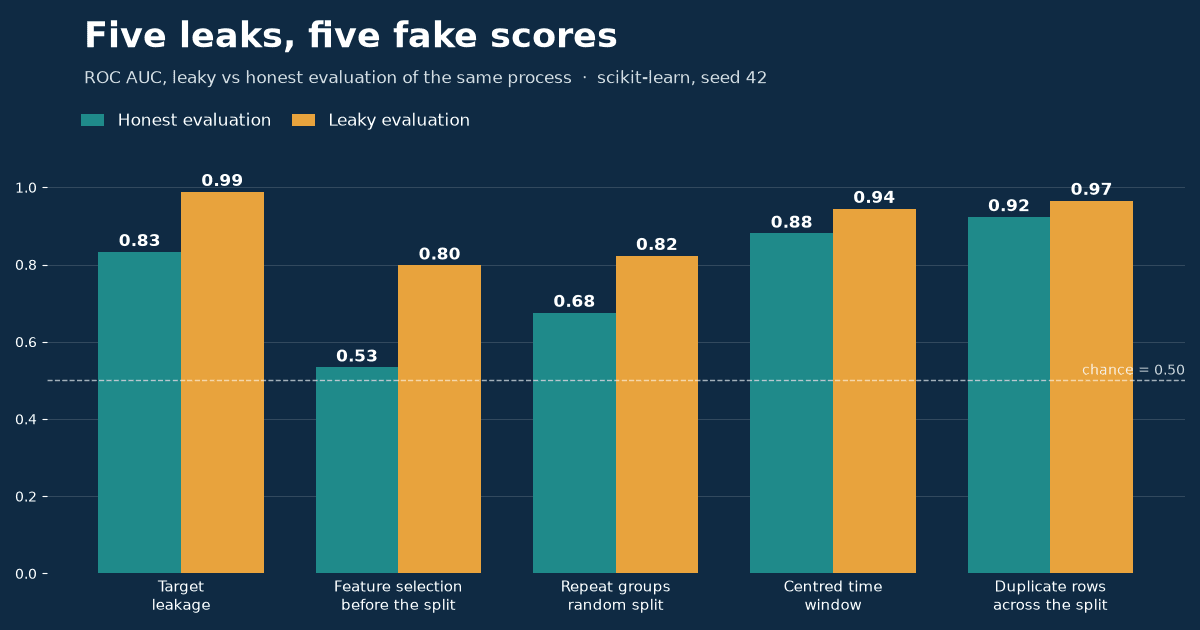
Five Leaks That Inflate Your AUC: I Measured Each One
Five controlled experiments, one per leak: honest AUC vs leaky AUC on the same data-generating process. Target leakage bought +0.16, pre-split feature selection +0.26, repeat groups +0.15.
Ibrahim Denis Fofanah·Oct 19, 2026·11 min